A SoBigData TNA experience by Shadrock Roberts
The impetus for me to become a SoBigData fellow came to mind while I was monitoring the use of crowdsourcing for the Kenyan Presidential elections of 2017. The company I work for, Ushahidi, was born during the post-election violence of the 2007 Kenyan elections, when widespread violence and a government blackout to stifle information, were countered with the first version of the Ushahidi platform: used to collect testimony and eyewitness reports events unfolding throughout the country.
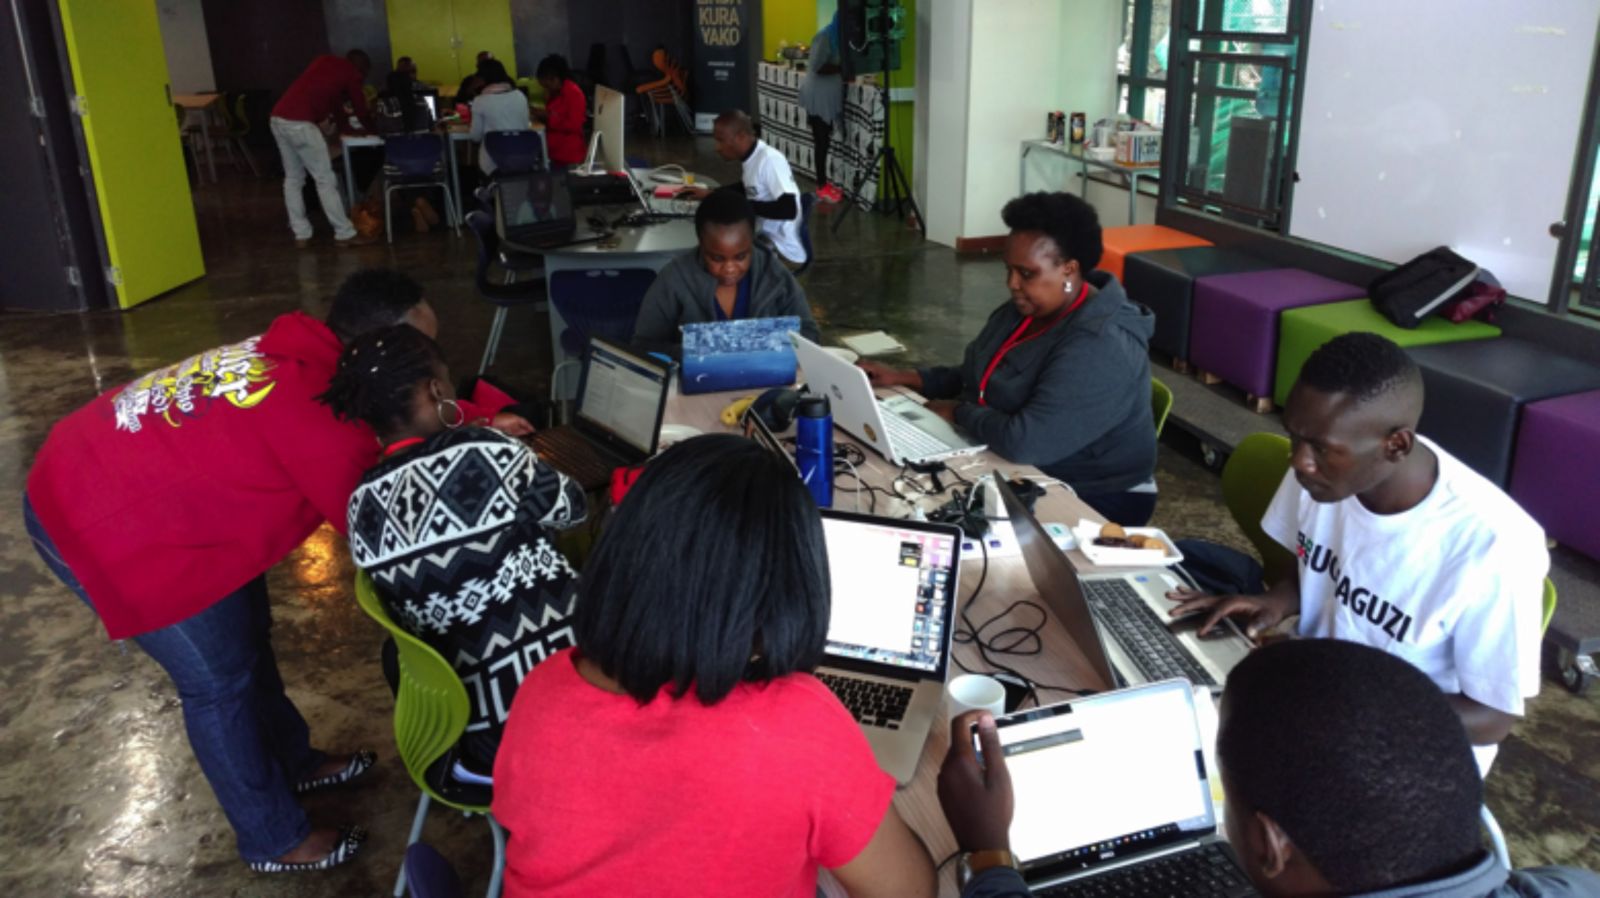
The “Uchaguzi” monitoring team at work during the Kenyan General Election of 2017
Ushahidi has implemented its software to help monitor every Kenyan general election since. As I was assisting with our monitoring project in 2017, I noticed that we had received only 4 reports for the neighborhood of “Kibera,” which is one of Africa’s largest informal settlements and is often a flashpoint for tensions area during elections. I brief examination of Twitter revealed than 20 thousand mentions of the area. The discrepancy between what I was seeing on social media and what I was seeing in Ushahidi suggested that we were missing something big. The qualitative work I did in the field suggested that crowdsourcing of incoming reports might be reaching a limit that could be overcome with Natural Language Processing, which could provide an important way forward for Ushahidi. Our ability to serve the users of our software will benefit from improved methods in data science and social media analytics. My SoBigData project was to compare the Ushahidi and Twitter data sets to see which types of events each data set captured, if they were comparable, and if one could be used to say anything about the other.
Perhaps, unsurprisingly, the original Twitter dataset of 19,899 Tweets contained only 3,240 Unique Tweets mentioning “Kibera” created by 2,196 unique accounts. Of those accounts, only 21 (0.95% of total) Tweeted 10 times or more for a total of 412 Tweets (12% of all Tweets). While 74 accounts (3.4% of total) Tweeted 5 times or more for a total of 750 Tweets (22% of all Tweets). This is, more or less, a usual power-law distribution. The vast majority of these Tweets seemed to be little more than commentary (often partisan) and held a relatively small number of Tweets containing any relevant, on-the-ground, information.
The Ushahidi data, by contrast, was incredibly small: only 18 reports were published for the area under investigation. And of these, only 4 contained what might be considered “crisis events.” From this, one could surmise that Ushahidi had, in fact, done an excellent job of filtering out much of the noise found in the Twitter data and presenting users with actionable information. However, when compared to qualitative data, it appears that the few “crisis events” that appeared in the Ushahidi data were already known to crisis responders. Nevertheless, I have yet to find any crisis events in the Twitter data that Ushahidi “missed” and it could be said that Ushahidi, at least, managed to present a view of what was happening in the ground which was free from so much of the noise found in the Twitter data.
While I was not able to completely finish my analysis during my time with SoBigData, I was able to work with cutting edge techniques that allowed me to process data I wouldn’t have been able to otherwise. I was also able to work with a team of experts who helped me extend my initial research protocol to continue mining the data for further insights. Thanks to the team at GATE and the University of Sheffield, I am currently trying to determine more about the unique accounts that were driving much of the Twitter conversation including: what hashtags they were using and how these differed from Ushahidi; whether they were based in the area under investigation or foreign-based; and to what degree overt partisan sentiment can be detected in their commentary.