
Geolet: An Interpretable Model for Trajectory Classification
Geolet simplifies complex mobility data and outperforms black-box models in terms of accuracy while being much faster. This innovation allows for more informed decisions in various domains like traffic management and disease control, thanks to its improved interpretability.
The availability of large amounts of diverse mobility data has enabled the development of predictive models capable of recognizing various types of movements. Moving entities, such as animals, people, or vehicles, can generate spatiotemporal trajectories using GPS devices, which can be used to infer migration patterns, manage traffic in large cities, and monitor disease spread and impact. Such critical situations necessitate a thorough understanding of the underlying problem, given that mobility data is required for researchers, businesses, and governments to make decisions that affect people's lives in many ways [1,2]. However, the deep learning models employed in this field are often accurate but opaque, making them challenging to interpret from a human perspective [3].
Trajectory classifiers can be grouped into various families. Traditional methods typically extract global or local features from data, whereas modern methods use complex, deep learning-based models to process raw trajectories directly. Depending on the classification model used after the dataset transformation, traditional methods [4,5] can be considered pseudo-interpretable procedures. For example, a Random Forest can be used to determine the average importance of each variable. The main issue, however, is that interpretability varies according to the complexity of the extracted features and the number of weak learners in the ensemble. Only a few deep learning-based models are specifically studied for trajectory classification [6,7,8] and are based on RNNs or CNNs. Due to their inherent opacity, several XAI approaches have been proposed, but they can only output explanations as saliency maps.
Our method attempts to overcome the interpretability limitations of black-box models and optimize accuracy and runtime, often the main problems of feature extraction-based methods. We take inspiration from studies on XAI from time series [9], specifically shapelets [10] to present the GEOgraphic ShapeLET classifier, Geolet, an interpretable classification approach for trajectory data. First, Geolet uses Geohashing or Voronoi Tesselation to segment the input data into subtrajectories. Then, Geolet selects the most discriminative ones using Mutual Information. Finally, Geolet computes the similarity score between the selected subtrajectories and the trajectory in the dataset. The resulting simplified dataset can then be used with any machine learning classifier. Our approach has been tested against state-of-the-art competitors on real-world datasets, outperforming black-box models in terms of accuracy while being orders of magnitude faster than its interpretable counterparts.
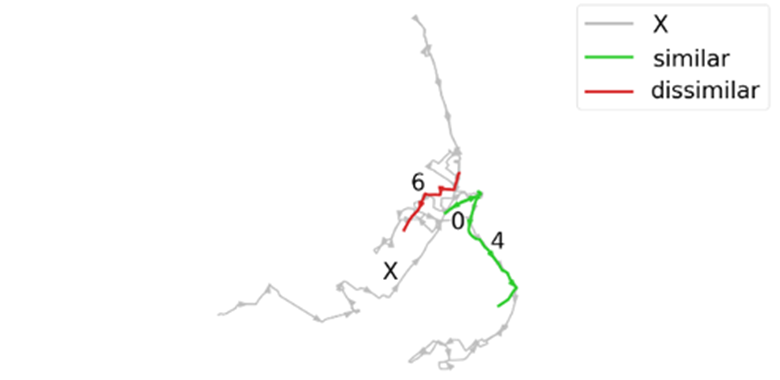
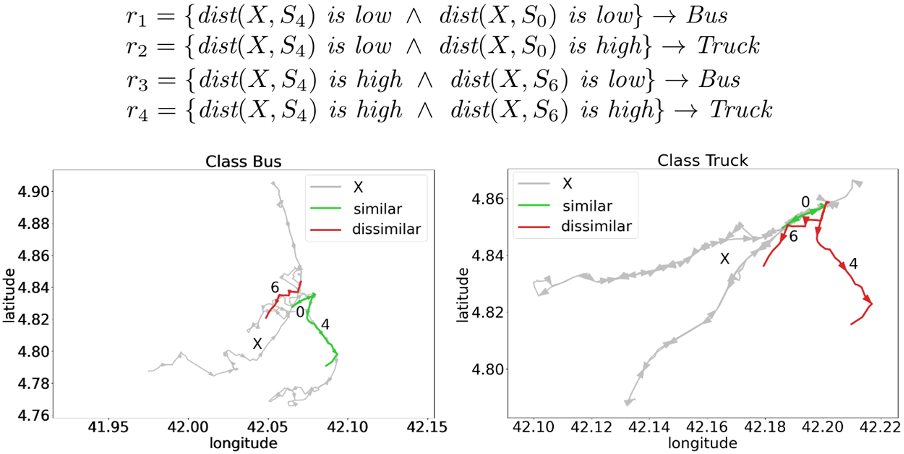
We show an example of Geolet on the dataset "Vehicles", a trajectory classification dataset where the main task is distinguishing between GPS trajectories made by buses or trucks in the Athens area. For this example, we use a Decision Tree as a classification model, which allows us to extract rules summarizing its decision boundaries. These rules show that the most representative subtrajectories are those with indices 0, 4, and 6. We can now understand the decisions of the classifier by visualizing where the subtrajectories fit within the trajectory. In the Figure, we present the classification of Geolet for two instances. In particular, the instance belonging to the class Bus has segments very similar to subtrajectories 0 and 4 but quite different from subtrajectory 6. On the other hand, the Truck instance contains almost perfectly the subtrajectory 0, but it is quite different from 4 and 6.
In conclusion, Geolet is able to transform trajectory data into a simplified representation that any classifier can use as an interpretable input source while outperforming state-of-the-art competitors in terms of accuracy.
References:
[1] Andrienko, G.L., Andrienko, N.V., Boldrini, C., Caldarelli, G., Cintia, P., Cresci, S., Facchini, A., Giannotti, F., Gionis, A., Guidotti, R., Mathioudakis, M., Muntean, C.I., Pappalardo, L., Pedreschi, D., Pournaras, E., Pratesi, F., Tesconi, M., Trasarti, R.: (so) big data and the transformation of the city. Int. J. Data Sci. Anal. 11(4), 311–340 (2021)
[2]da Silva, C.L., Petry, L.M., Bogorny, V.: A survey and comparison of trajectory classification methods. In: BRACIS. pp. 788–793. IEEE (2019)
[3]Guidotti, R., Monreale, A., Ruggieri, S., Turini, F., Giannotti, F., Pedreschi, D.: A survey of methods for explaining black box models. ACM computing surveys (CSUR) 51(5), 1–42 (2018)
[4]Ferrero, C.A., Alvares, L.O., Zalewski, W., Bogorny, V.: MOVELETS: exploring relevant subtrajectories for robust trajectory classification. In: SAC. pp. 849–856. ACM (2018)
[5]Xiao, Z., Wang, Y., Fu, K., Wu, F.: Identifying different transportation modes from trajectory data using tree-based ensemble classifiers. ISPRS Int. J. Geo Inf. 6(2), 57 (2017)
[6]Petry, L.M., da Silva, C.L., Esuli, A., Renso, C., Bogorny, V.: MARC: a robust method for multiple-aspect trajectory classification via space, time, and semantic embeddings. Int. J. Geogr. Inf. Sci. 34(7), 1428–1450 (2020)
[7]Kontopoulos, I., Makris, A., Tserpes, K., Bogorny, V.: Traclets: Harnessing the power of computer vision for trajectory classification (2022)
[8]de Freitas, N.C.A., da Silva, T.L.C., de Macˆedo, J.A.F., Junior, L.M.: Using deep learning for trajectory classification in imbalanced dataset. In: FLAIRS Conference (2021)
[9]Theissler, A., Spinnato, F., Schlegel, U., Guidotti, R.: Explainable AI for time series classification: A review, taxonomy and research directions. IEEE Access 10, 100700–100724 (2022)
[10]Ye, L., Keogh, E.J.: Time series shapelets: a new primitive for data mining. In: KDD. pp. 947–956. ACM (2009)